PurpleState Map Tool
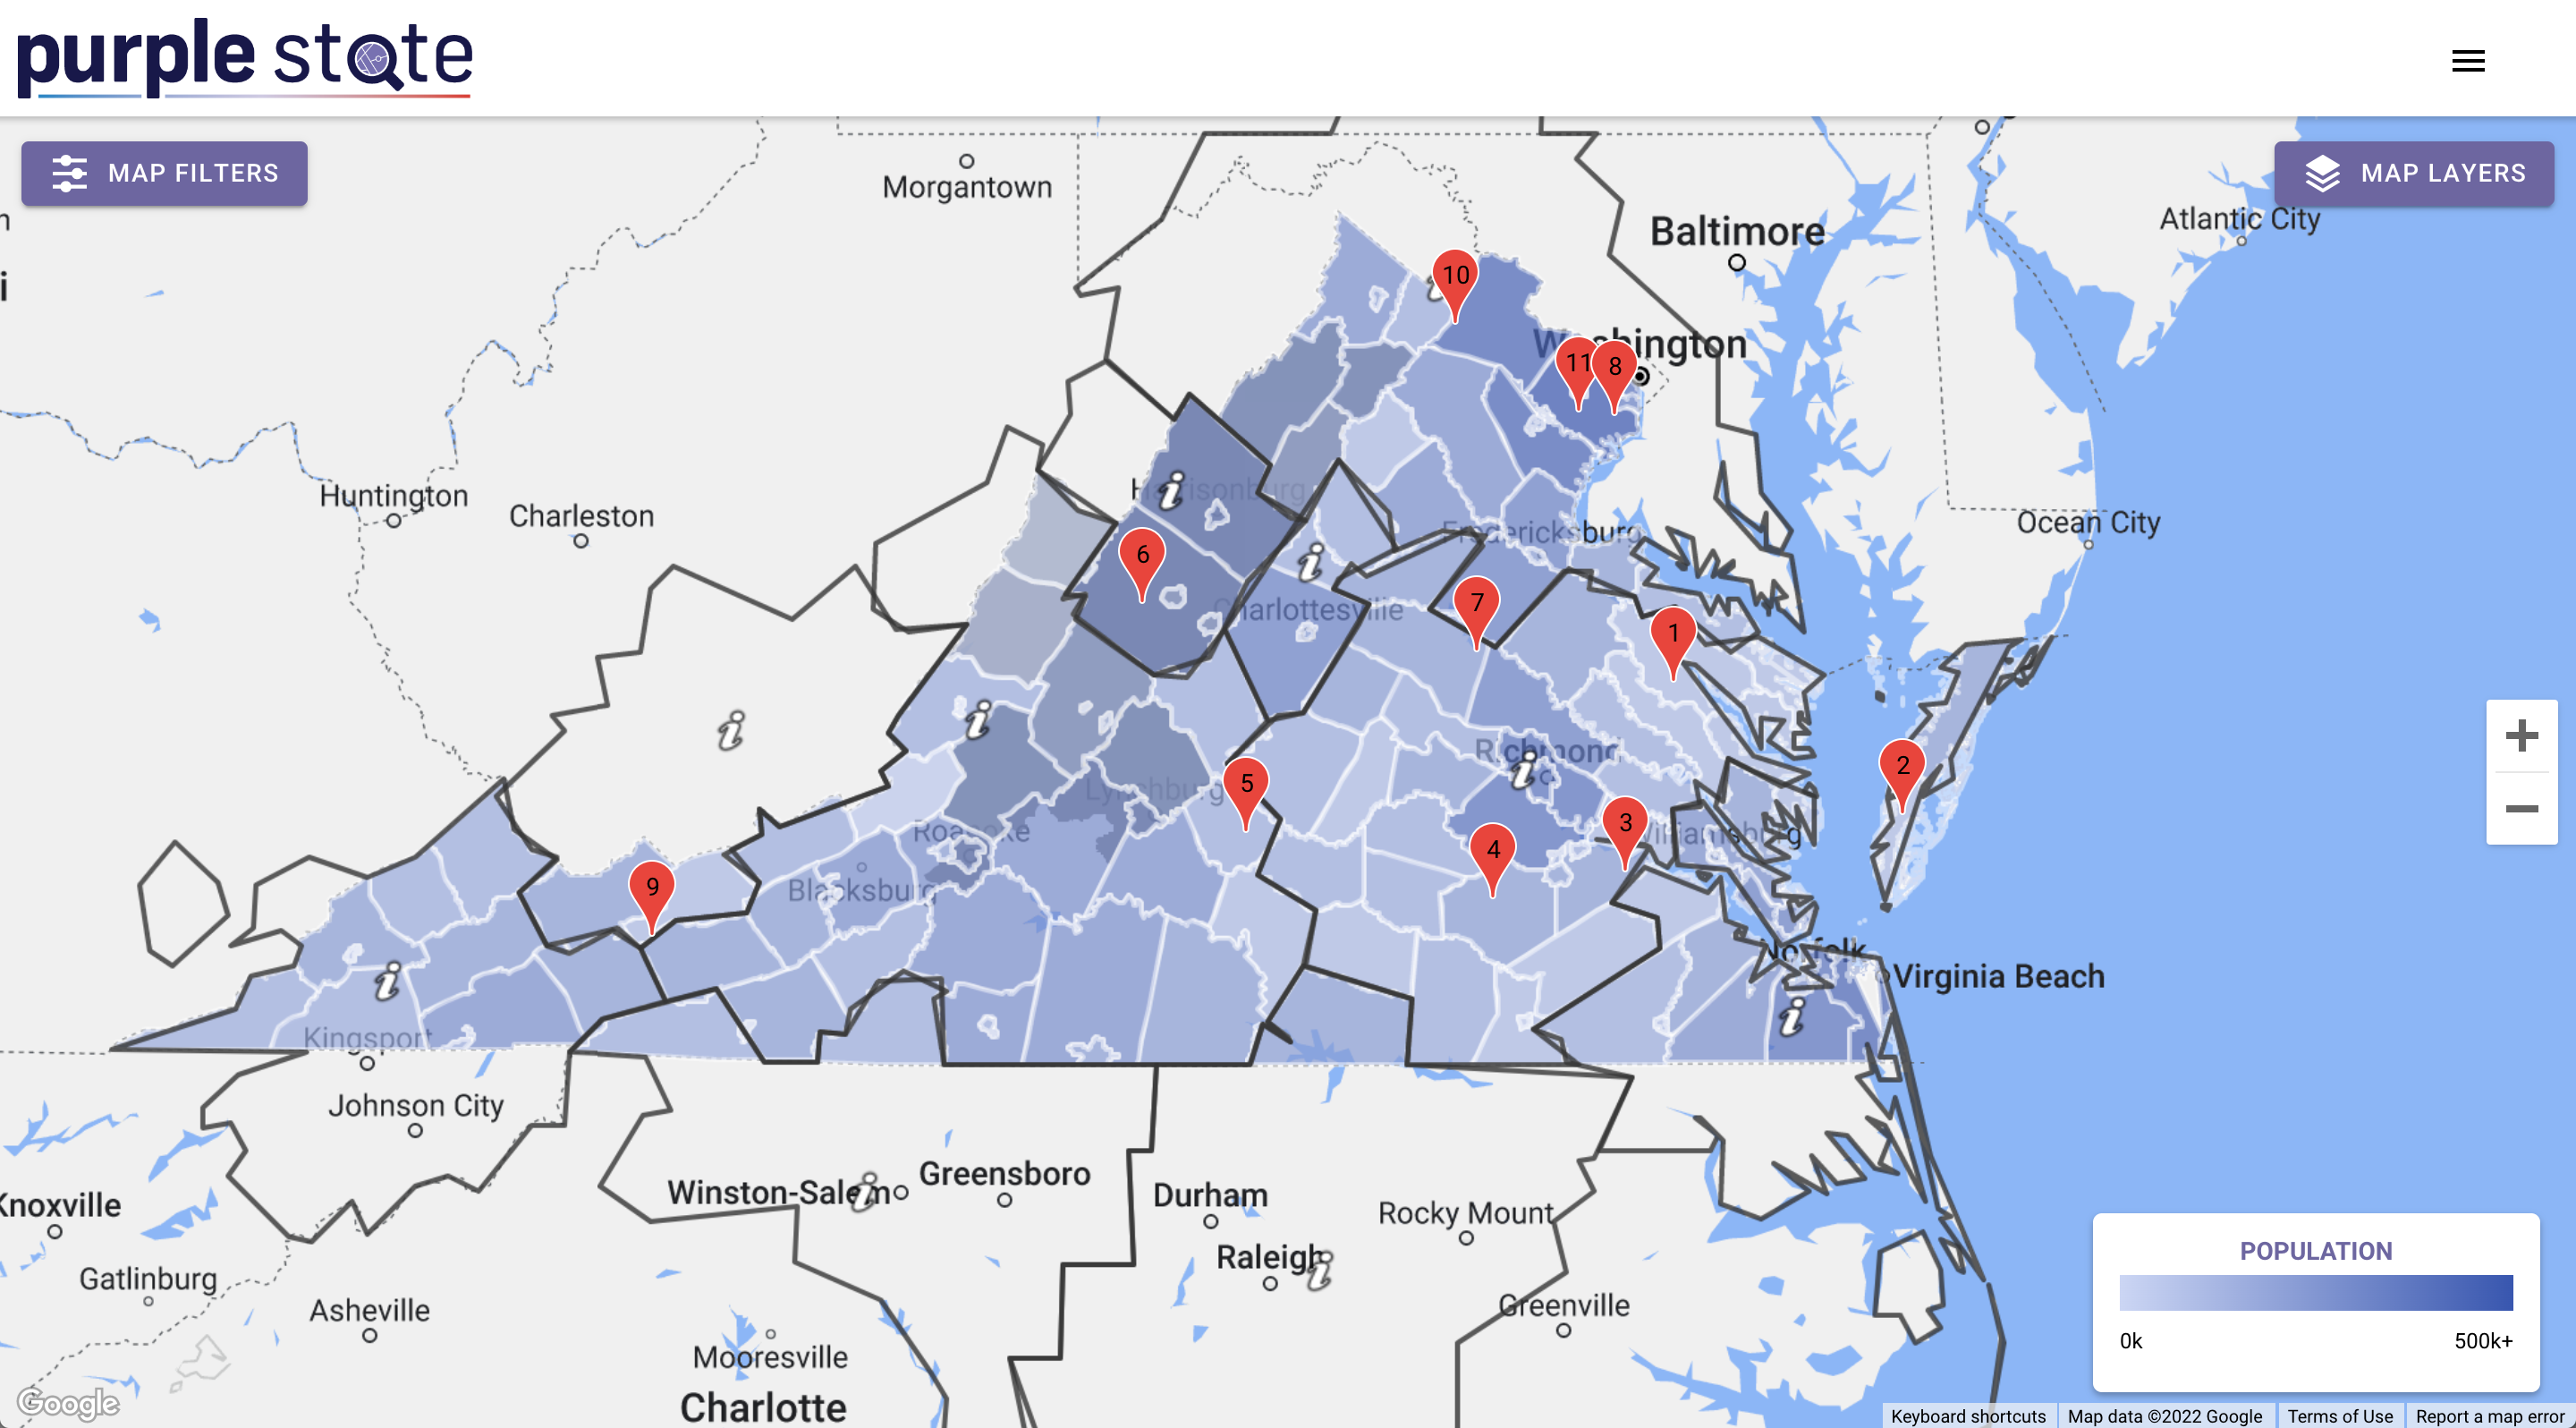
The PurpleState Map Tool uses real data from organizations like the U.S. census to provide students with a visual representation of their state’s political and demographic landscapes. Using a variety of layers and filters, the map tool helps students to understand the location and distribution of major voter groups, population centers, state news organizations, and media markets. The map is designed to help students explore inquiry questions using the data visualization layers. This may include examining questions about where specific state populations reside or examining news and media information in its political or demographic context.
In PurpleState, students use the map to examine where target audiences reside and how specific policy issues are talked about in news reports around different regions of the state. This information is then used to inform which media markets they will target for their campaigns.
The Map Layers illustrate overall state trends:
- Population: This layer uses census data to show county populations across the state.
- Voting History: This layer provides an overview of general political trends by using county voting results from the recent Governor election.
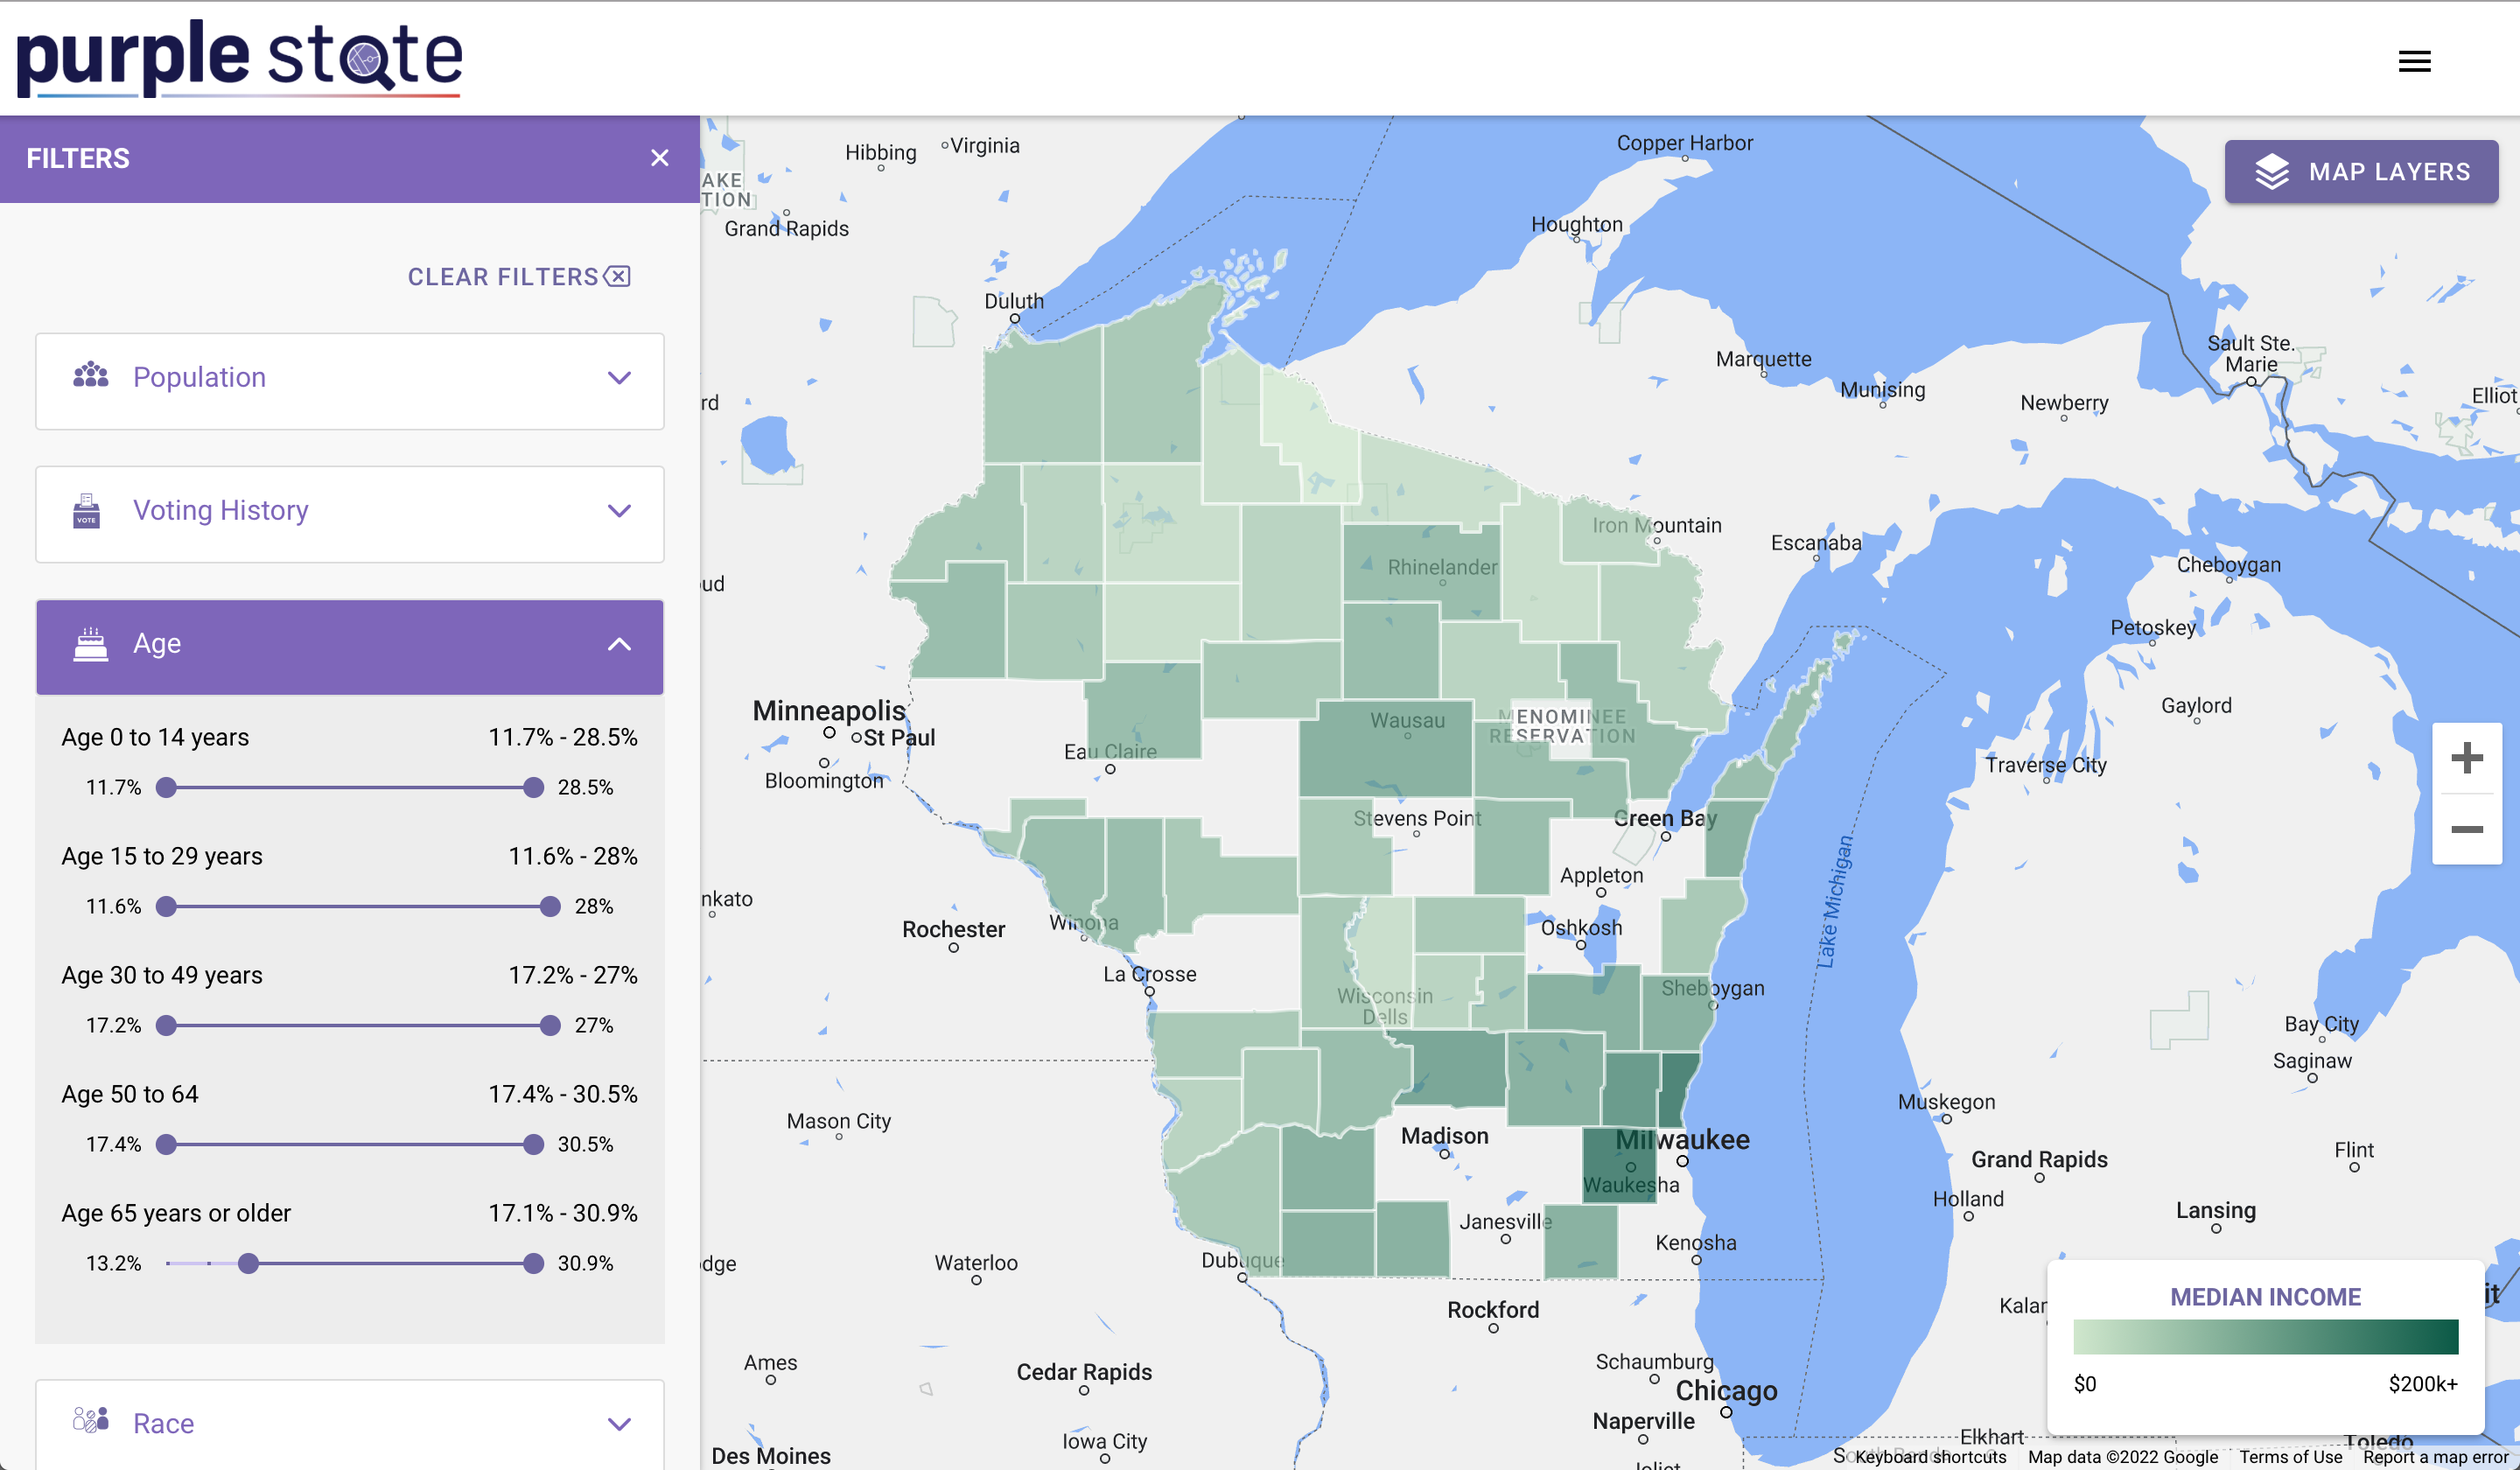
- Income: This layer uses census data to illustrate average income across counties.
- Media Markets: This layer shows how the state is broken into broadcast television markets, as defined by the Nielsen rating agency. This organization gathers information about how many people in the media market watch particular television shows in order to set the costs of advertising. We use these media markets to assess the relative costs of television, radio, and newspaper advertisements in these regions.
- Congressional Districts: This layer shows how the state is divided into voting districts for its representatives to Congress.
- Local News: In the demo maps, this layer includes links to local news organizations. Maps accessed through your free registration show local news stories on topics including gun control, mandatory minimum sentencing, and green energy policy.

In addition to statewide information, students can explore local demographic data from specific counties. By clicking on any county in the map, students can access additional census demographics like total population, age, race, and political views (based on recent polling data).
The Map Filters allow our students to quickly identify where different demographic groups live in the state. Filters can be used along with the map layers to look at combinations of demographic categories – such as where the largest groups of wealthy individuals over the age of 65 live.
